
By the Numbers
2025 Financial Information
Consistency...The year 2025 was a year of chaos, and yet, the financial markets did well.
Clouds of uncertainty created by changing government policies did not disrupt the strong fundamentals of our financial markets. Our funds maintained the same investment policy we have used for years. We invested in many different classes of investments, both equity and fixed income, domestic and international. Diversification offers the best guarantee of safety.
Our balanced funds returned 15.86%, which is well above our average of about 9%. The growth of our assets and our grantmaking was the largest ever achieved. The following graphs show a strong performance in every measure.
As the Community Foundation has grown financially, we have also increased the area that we serve. In 2018 we re-named our corporation Commonwealth Charitable Management, Inc. and established two divisions. The first division is the Community Foundation of the Endless Mountains which focuses on northeast Pennsylvania with donor advised funds and funds for organizations. The second division is Commonwealth Tax Credit Programs, which administers a variety of state tax credit programs that support organizations and resources throughout Pennsylvania. These divisions are supported by the same staff and the same board of directors. The reports that are presented here are consolidated for the entire corporation. When we refer to the Community Foundation, we include the entire corporation.
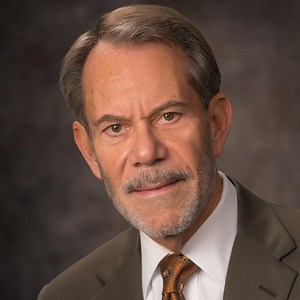
Earle Wootton
Chairman of The Community Foundation
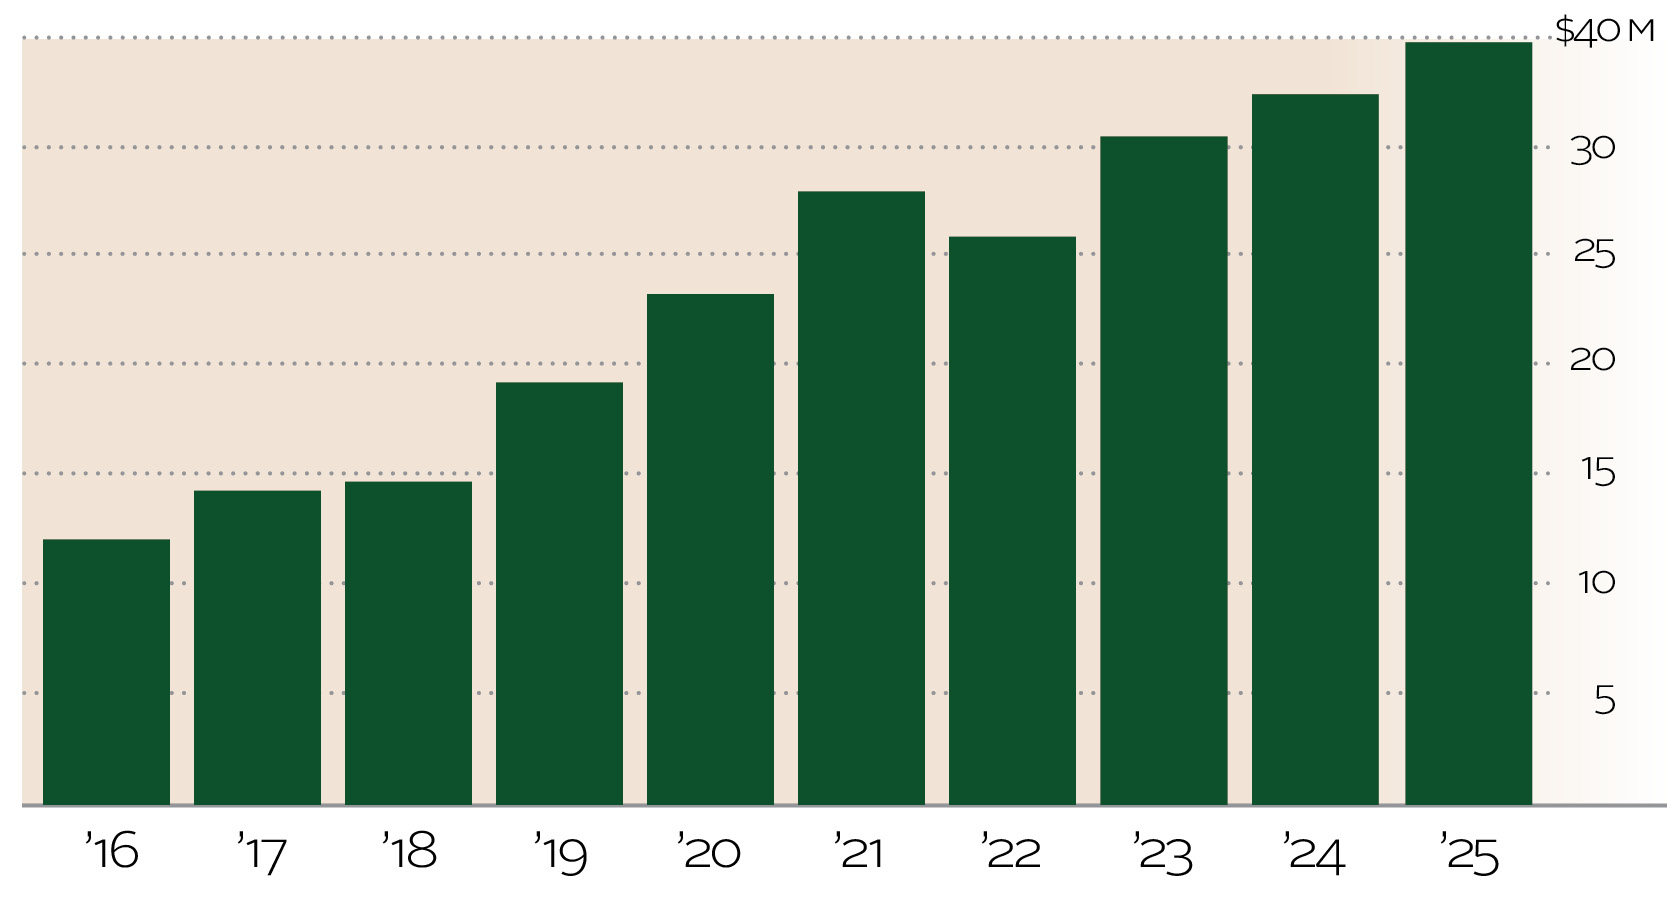
TOTAL ASSETS
The total assets of the Community Foundation rose 13.9% or about $5,000,000 to an all-time high of nearly $40 million. This growth is our largest. Our growth included new types of tax credit programs that benefit organizations throughout the state, although most of our impact remains in northeastern Pennsylvania.
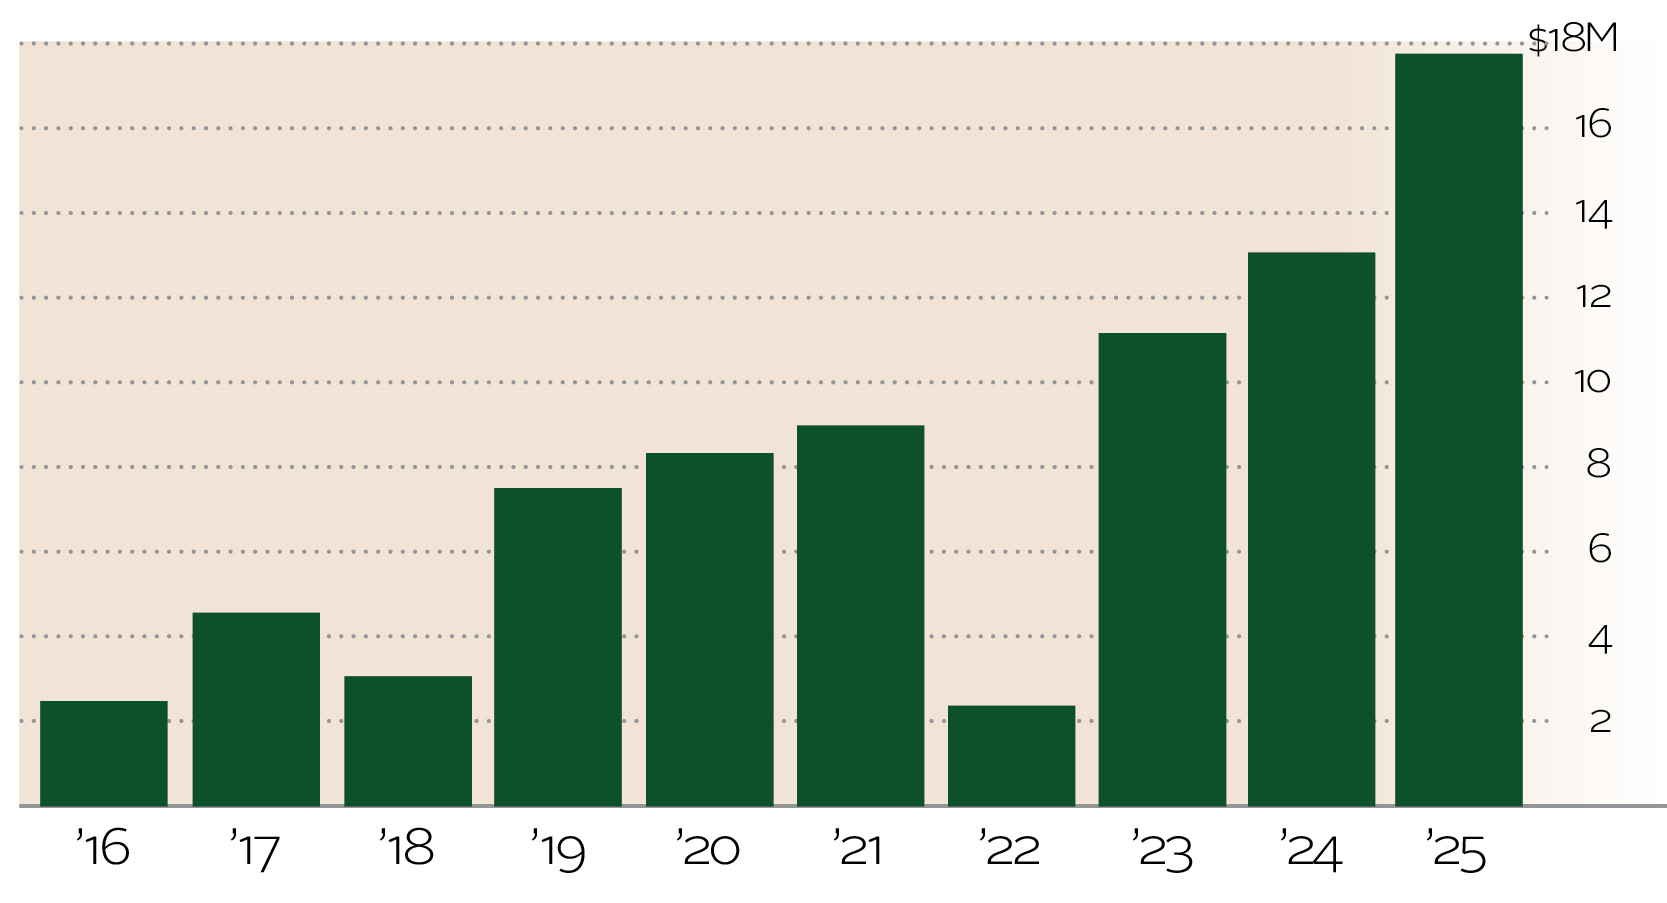
TOTAL REVENUE
Total Revenue increased $4.8 million or 37.1% to $17,768,089. This amount includes investment revenue. This is the largest amount of revenue we have ever received in one year.
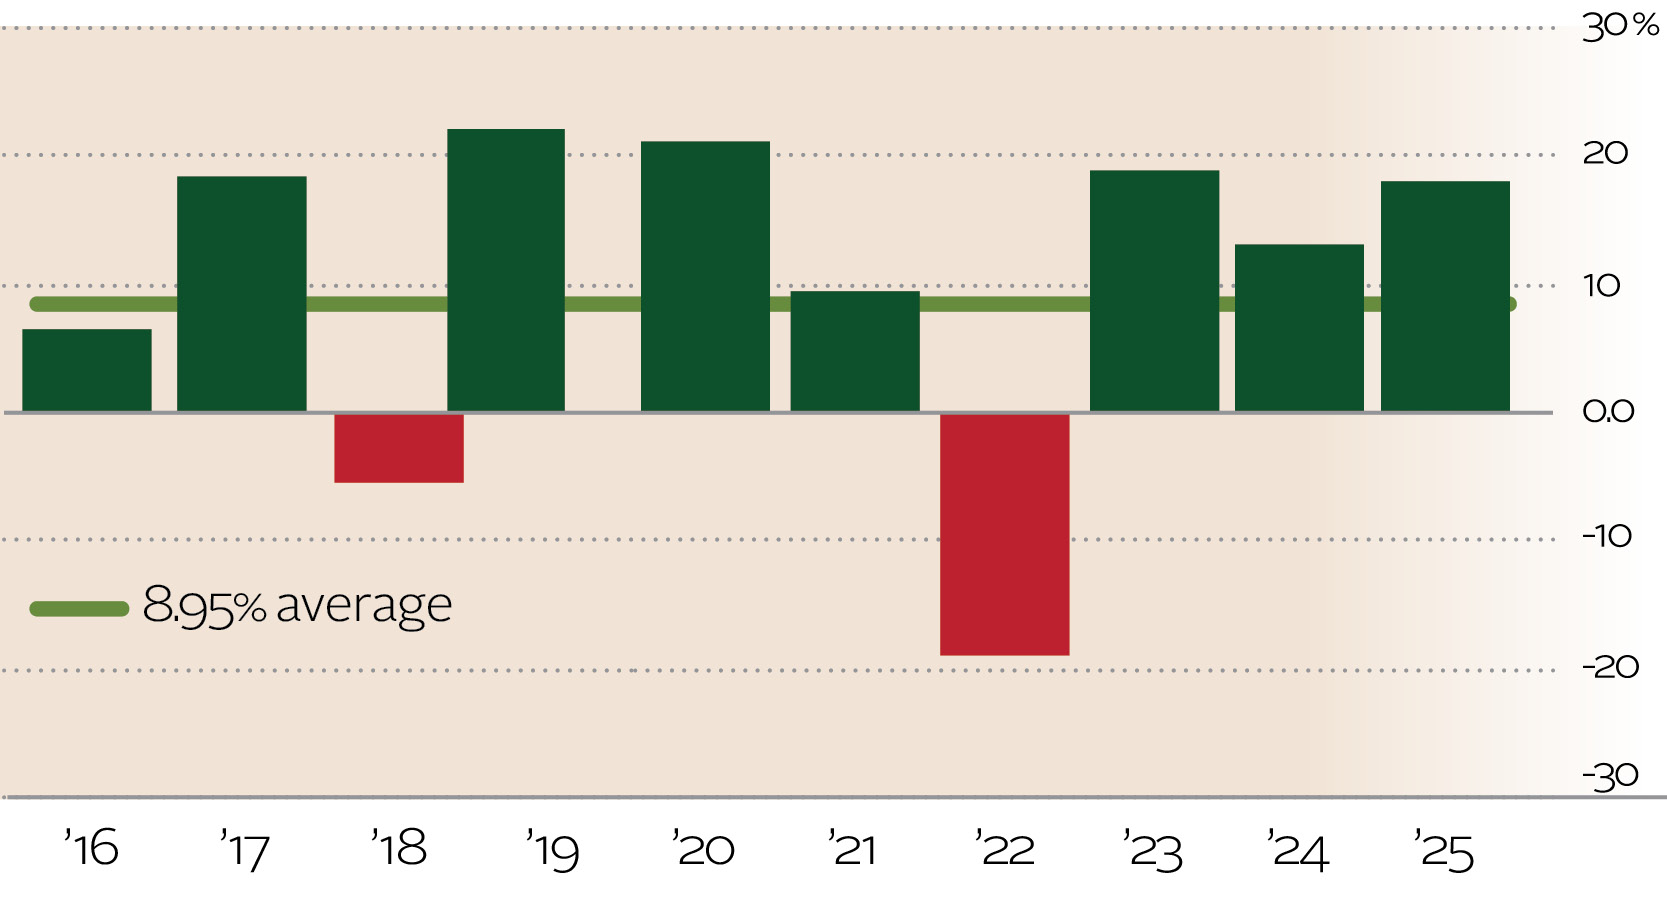
INVESTMENT RETURN
The Investment Return for all funds was 16.14%. The balanced investment portfolio returned 15.86%. This fund is invested in both stocks and bonds in a ratio of 60%:40%. Our average return over a period of ten years for the balanced investment portfolio is 8.95%. The ten-year average return on all funds was 10.01%.
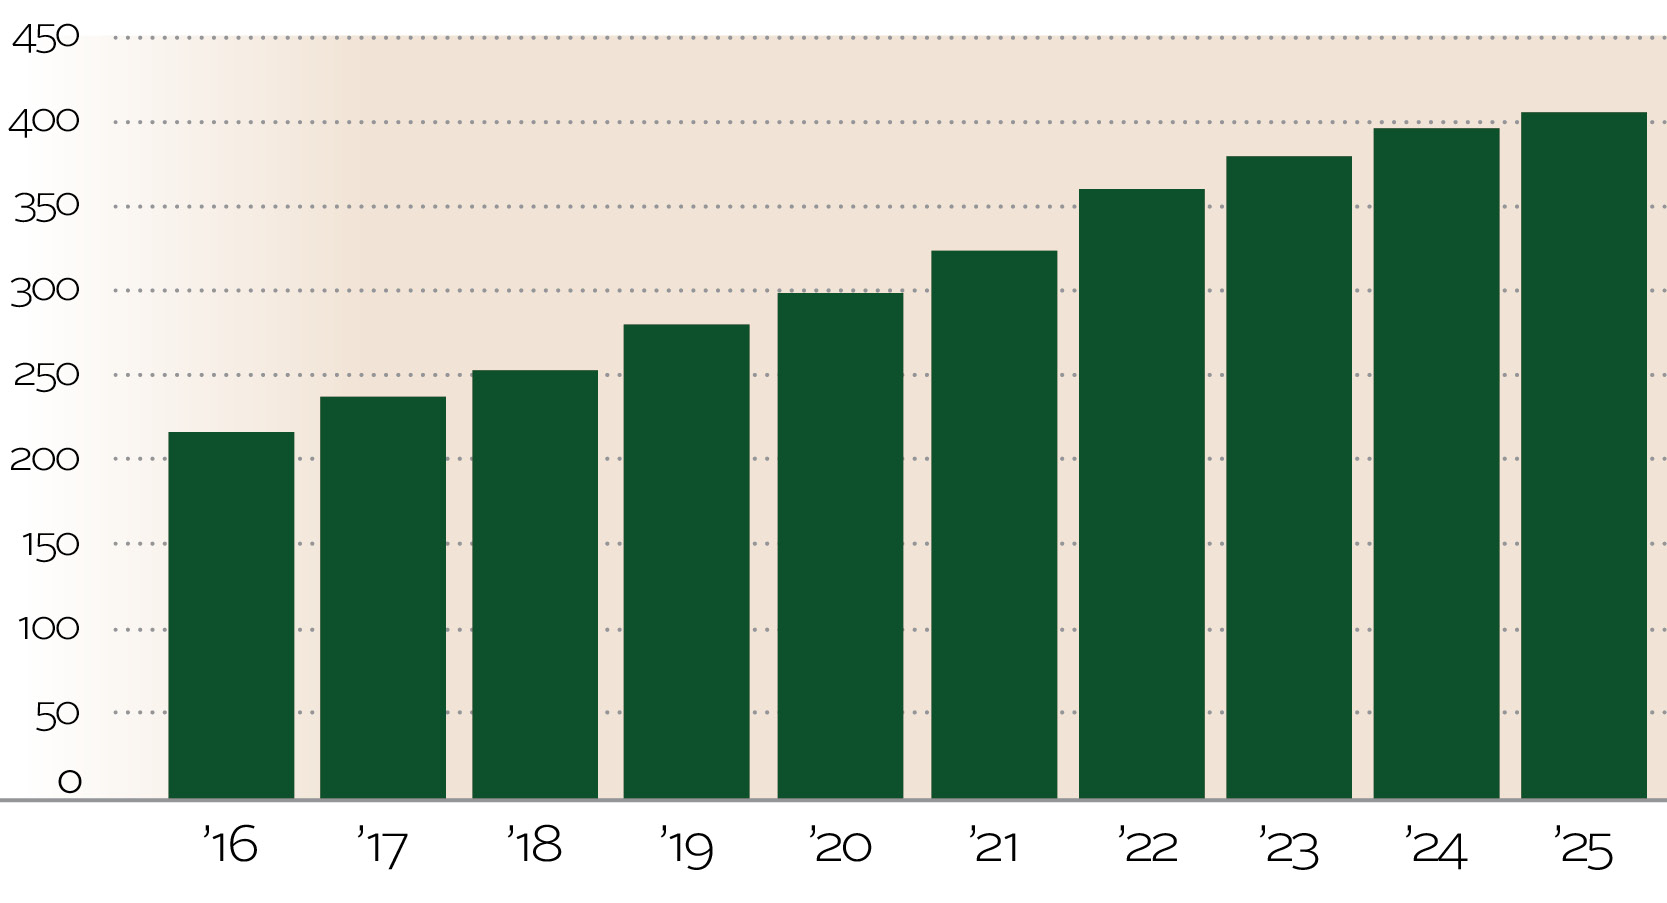
NUMBER OF FUNDS
The number of our funds increased by 12 to a total of 409. The growth is in line with prior years. The average size of a fund increased by 14.7% to $80,857.
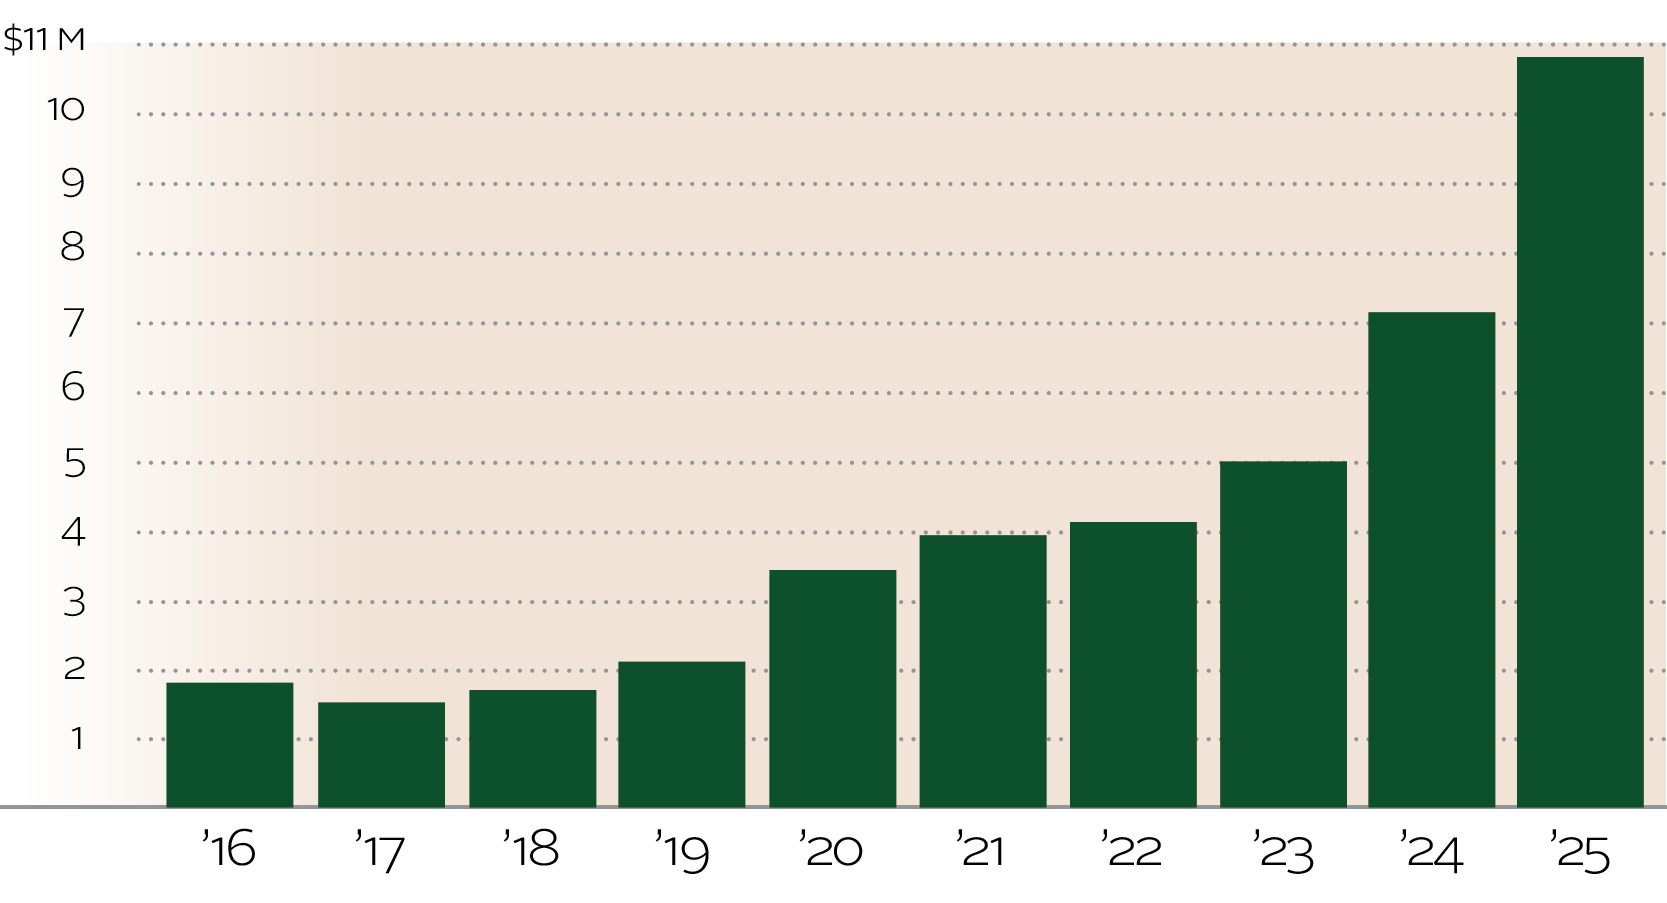
TOTAL VALUE OF GRANTS
The value of all grants increased 51.77% to $10,889,459. This was an increase of $3,714,658 over the value of grants in 2024. Many of these grants are in northeastern Pennsylvania with the greatest concentration in Susquehanna and Wyoming Counties.
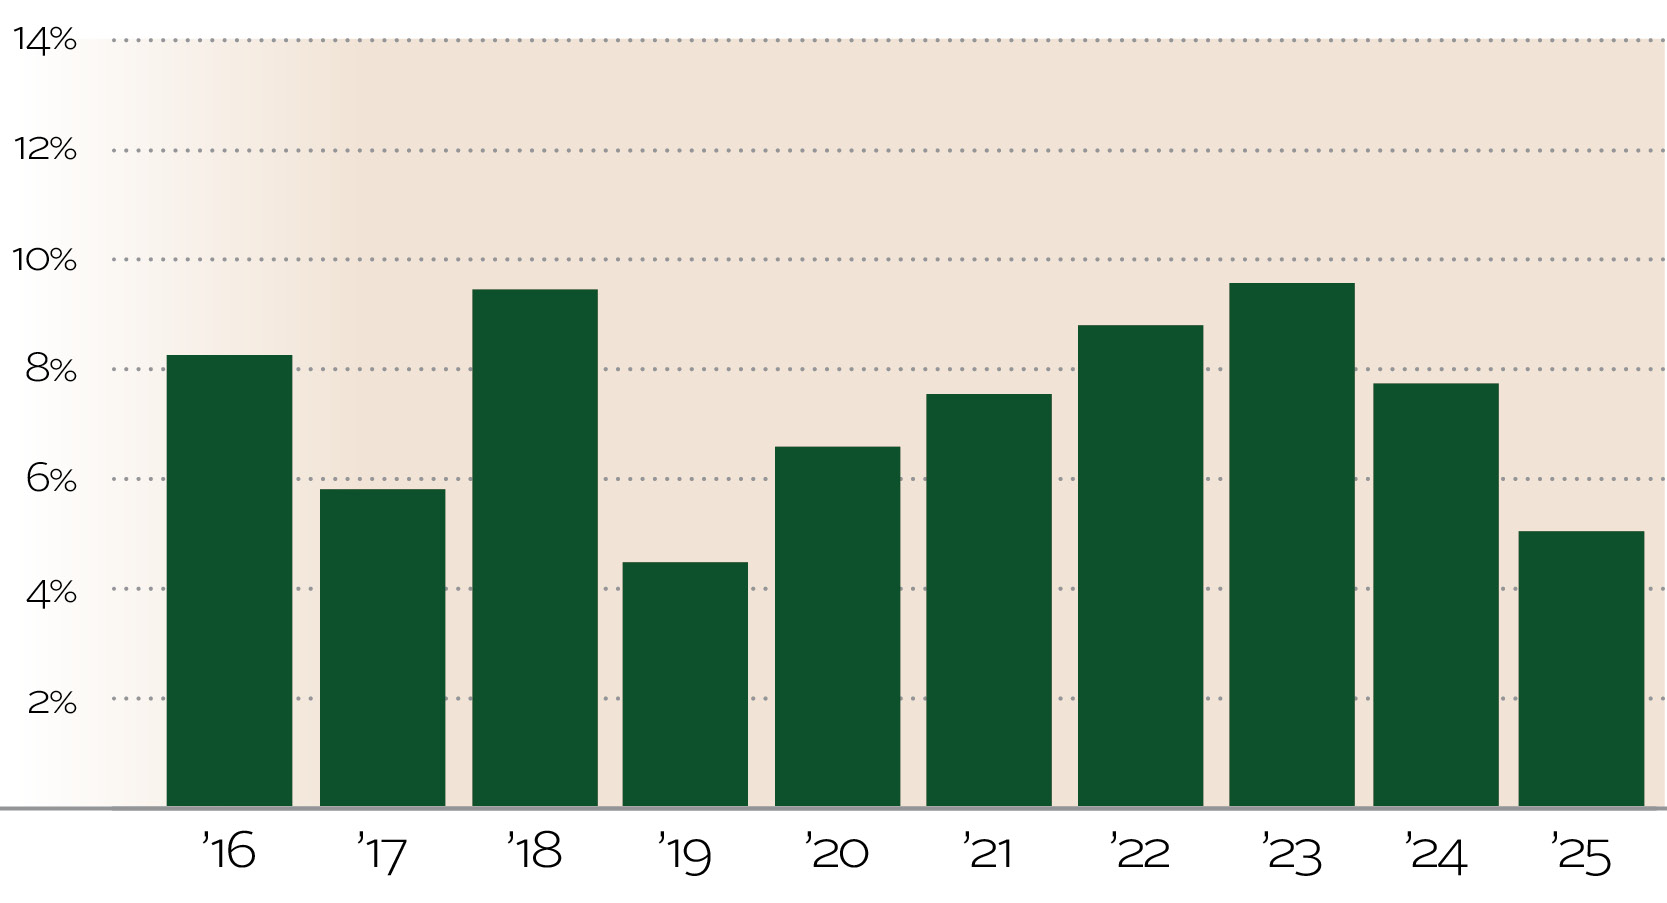
OPERATING EXPENSE RATIO
The operating expense ratio is the operating expense divided by the revenue. This is a measure of what it costs to run the foundation. This ratio is 5.50% which means that the Foundation spends 5 ½ cents for every dollar it raises.